
Guides / Analytics
How to make analytics work for your business
Turn website analytics into decisions: what to track in GA4, how to read engagement and key events, and what to change as a result.
Data
Analytics
In this guide
- Why website analytics matters
- How to set up website analytics
- What to measure: KPIs and key events
- How to read your website data
- Using analytics to improve your website
- Using analytics to improve your marketing
- Using analytics to improve sales
- Make it a habit: a monthly analytics review
- Frequently asked questions
The short answer
To make analytics work for your business, decide what a successful visit looks like, track it as a key event in Google Analytics 4 (GA4) and review the results on a fixed schedule. In Ireland, analytics cookies need a visitor’s consent, so run GA4 with a cookie banner and Google Consent Mode v2. Then use engagement rate, key events and traffic sources to decide what to change.
Key takeaways
- Start from your business goals: pick three to five KPIs and track each action behind them as a GA4 key event (Google renamed GA4 ‘conversions’ to key events in 2024).
- The Data Protection Commission (DPC) treats analytics cookies as needing consent, and since March 2024 Google has required Consent Mode v2 to keep its measurement and ad features for visitors in the European Economic Area.
- In GA4, bounce rate is the share of sessions that weren’t engaged. An engaged session lasts longer than 10 seconds, has a key event or has two or more page views.
- Judge marketing channels by the key events and revenue they bring, not by visits.
- Set GA4 data retention to 14 months so you can compare this year with last year in detailed reports.
- A monthly review that ends with two or three actions is worth more than a dashboard nobody opens.
Why website analytics matters
Website analytics tells you where your visitors come from, what they do on your site and whether they become customers. Without it, you can’t tell which marketing is paying for itself and which is wasting money.
Analytics is only useful when it changes a decision. The aim isn’t more reports: it’s knowing which pages, channels and campaigns to fix, fund or stop. Everything below is built around that.
How to set up website analytics
Setting up analytics means choosing a platform, adding its tracking code to your site, handling cookie consent and telling the platform which actions count as success. Most businesses use Google Analytics 4, which is free and works with Google Ads and Google Tag Manager. Matomo, Piwik PRO and Adobe Analytics are the main alternatives, compared in our guide to the best analytics platforms.
- Create your GA4 property and add the Google tag to every page, either directly or through Google Tag Manager.
- Add a cookie consent banner so analytics cookies are only set once a visitor agrees, and connect it to Consent Mode v2.
- Mark your key events. Decide which actions matter (an enquiry form, a phone-number click, a purchase) and mark them as key events.
- Set data retention to 14 months. Standard GA4 properties keep detailed user and event data for either 2 or 14 months, so check the setting under Admin.
- Link Google Ads and Google Search Console so you can see paid campaigns and organic search queries alongside what visitors did next.
- Test it. Submit your own form and make a test purchase, then confirm each one appears in GA4’s real-time report.
Cookie consent and Consent Mode v2 in Ireland
In Ireland and the rest of the EU, analytics cookies need a visitor’s consent before they’re set. The DPC’s cookie guidance says so directly, and adds that a banner with an ‘accept’ button must give equal prominence to an option to reject. It also says consent shouldn’t be relied on for longer than six months before you ask again.
The DPC says first-party analytics cookies used only for aggregated statistics are unlikely to be an enforcement priority, but that doesn’t remove the need for consent. If you use GA4 or Google Ads, Google’s Consent Mode v2 passes each visitor’s consent choice to Google. Since March 2024 it has been needed to keep using Google’s measurement, ad personalisation and remarketing features for visitors in the European Economic Area.
Fewer visitors will show up in GA4 once consent is in place, because some people decline cookies. Compare periods measured the same way, and don’t panic at the drop the week your banner goes live.
What to measure: KPIs and key events
A key performance indicator (KPI) is a number that tells you whether your website is doing its job for the business. Choose a handful that link directly to revenue or leads, then track the visitor actions behind them as key events in GA4.
In GA4, a key event is any event you mark as important to your business, such as a purchase or a submitted enquiry form. Google renamed GA4 ‘conversions’ to key events in 2024, and GA4 reports key event rates (per session and per user) in place of the old conversion rate.
| Type of business | KPIs to watch | Key events to track (GA4 event names where they exist) |
|---|---|---|
| Online shop | Revenue, e-commerce conversion rate, average order value | purchase, add_to_cart, begin_checkout |
| Services and B2B | Enquiries, cost per lead, key event rate | generate_lead (form submitted), phone and email clicks |
| Local business | Calls, bookings, direction requests | Click-to-call, booking completed, map link clicks |
| Content or membership | Engaged sessions, sign-ups | sign_up, newsletter form submitted |
For an e-commerce site, useful KPIs also include customer lifetime value and cart abandonment rate. For a lead-generation site, the most useful number is often one GA4 can’t see on its own: how many enquiries became paying customers. Keep a simple record of that in your CRM or a spreadsheet.
How to read your website data
Read your data in four layers: where visitors came from, how engaged they were, what they did and whether they converted. Website analytics tools group this into four types of data:
- Traffic data: how many people visit, where they come from (search, ads, social, email, other websites) and on what device.
- Engagement data: how long people stay, how many pages they view and how often they return.
- Key event (conversion) data: how many visitors complete an action you care about, such as a purchase or an enquiry.
- Behaviour data: which pages people view, in what order, and where they leave.
These are the GA4 metrics most worth knowing:
| Metric | What it means in GA4 | What to look for |
|---|---|---|
| Engagement rate | The percentage of sessions that were engaged (over 10 seconds, a key event, or two or more page views) | Pages or channels well below your site average |
| Bounce rate | The percentage of sessions that weren’t engaged: the opposite of engagement rate | High bounce on pages that should lead somewhere, such as service or product pages |
| Key event rate | The percentage of sessions (or users) that completed a key event | Which channels and landing pages convert best |
| Average engagement time | How long the page was actively in view | Very short times on long, important pages |
| Exits | The page a session ended on (in Explorations) | Exits from the basket, checkout or enquiry form |
GA4’s bounce rate isn’t the same as the one in the retired Universal Analytics, which counted visitors who left after viewing only one page. If you compare old reports with new ones, the numbers won’t line up.
Using analytics to improve your website
Analytics improves your website by showing you where visitors get stuck. Look for the pages with plenty of visits but low engagement or few key events: that is where a change will make the most difference.
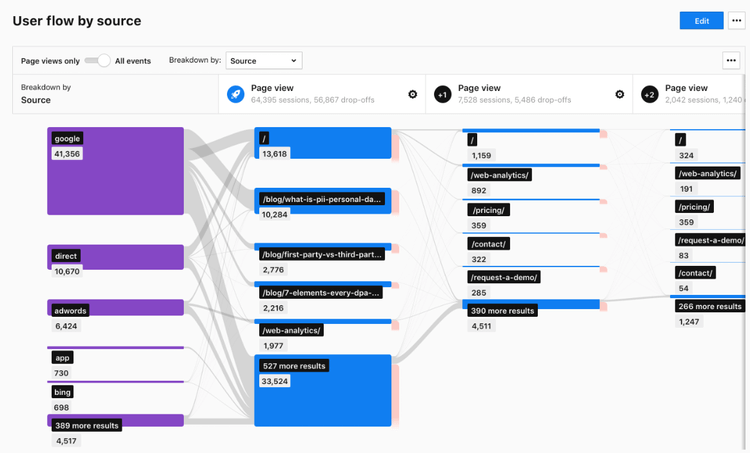
Follow the user journey
A user journey is the series of steps a visitor takes to reach a goal, such as landing on a product page, adding to basket and checking out. A path or funnel report shows how many people make it from each step to the next. A sharp drop between two steps points to the problem, whether that is a confusing form, unexpected delivery costs or a slow page.
Common problems and what the data shows
- People leave a landing page within seconds: the page may be slow, or may not match the ad or search result that brought them there.
- Product pages get views but few add-to-baskets: look at pricing, photos, product descriptions and delivery information.
- Carts are abandoned at checkout: simplify the checkout, show costs earlier and offer the payment options your customers expect.
- A key page has low engagement on mobile: test it on a phone. Layout problems often only show up on small screens.
Using analytics to improve your marketing
Analytics improves your marketing by showing which channels and campaigns bring customers, not just visitors. Compare each channel’s key events and revenue against what it costs you, then move time and budget towards what works.
- Compare channels by results. In GA4’s traffic acquisition report, add key events and revenue next to sessions. A channel that sends half the visits but most of the enquiries deserves more attention.
- Check campaigns individually. Tag email and social links with UTM parameters so each campaign shows up separately rather than as general ‘email’ or ‘social’ traffic.
- Use location and audience data. If visitors from certain counties or age groups convert better, target them in Google Ads and social ads.
- Feed results back into ads. Importing GA4 key events into Google Ads lets its bidding aim for enquiries and sales rather than clicks, and GA4 audiences can power remarketing.
For a structured way to turn these findings into higher conversion rates, see our guide to conversion rate optimisation.
Using analytics to improve sales
For an online shop, analytics shows which products, prices and pages turn interest into sales. GA4’s e-commerce reports show product views, add-to-baskets and purchases for each item, so you can see where each one loses buyers.
- Products with many views but few sales often need better photos, clearer descriptions or a price check against competitors.
- Products that sell well from few views may deserve more prominence on your home page, in emails and in ads.
- Changes to pricing or offers can be judged on revenue and average order value before and after, rather than on gut feeling.
Make it a habit: a monthly analytics review
Analytics only pays off if someone looks at it regularly and acts. A short monthly review, with a weekly check on any paid campaigns, is enough for most businesses.
- Compare this month’s KPIs with last month and the same month last year.
- Check which channels brought the most key events and revenue, and what each cost.
- Find the three pages with the most visits but the weakest engagement or key event rate.
- Confirm tracking still works: every key event is still recording and the consent banner still loads.
- Agree two or three changes to make before the next review, and note them so you can check the effect.
Our guide to long-term digital marketing covers how this monthly review fits into the wider routine of keeping a website and marketing performing after launch.
Write down what you changed and when, next to your monthly numbers. Six months later it is the only reliable way to know which change caused which result.
Frequently asked questions
Is Google Analytics free?
Yes. Standard Google Analytics 4 (GA4) properties are free and include the reports most businesses need. Google sells a paid version, Analytics 360, aimed at large organisations with very high traffic.
Do I need cookie consent for Google Analytics in Ireland?
Yes. The Data Protection Commission’s guidance says analytics cookies need a visitor’s consent before they’re set, and your banner must make rejecting as easy as accepting. If you use Google Analytics or Google Ads, you also need Consent Mode v2 to keep Google’s measurement and ad features for visitors in the EEA.
What are key events in GA4?
Key events are the actions you mark as important to your business, such as purchases, enquiry forms or phone-number clicks. They replaced ‘conversions’ in GA4 in 2024, and GA4 reports key event rates in place of the old conversion rate.
What is the difference between bounce rate in GA4 and Universal Analytics?
In GA4, bounce rate is the percentage of sessions that weren’t engaged, meaning they lasted 10 seconds or less, had no key event and had only one page view. Universal Analytics counted any single-page visit as a bounce, so GA4 bounce rates are usually not comparable with older reports.
What is a good engagement rate in GA4?
There is no single figure that applies to every site, because engagement depends on your industry, traffic sources and page types. Compare your own pages and channels against your site average and track the trend over time.
How often should I check my website analytics?
Once a month is enough for most businesses, with a weekly check on any paid advertising. Each review should end with a short list of changes to make, so the data leads to action.
Sources
- Google Analytics Help: Engagement rate and bounce rate
- Google Analytics Help: About key events
- Google Analytics Help: Recommended events
- Google Analytics Help: Data retention
- Google Analytics Help: Universal Analytics has been replaced by Google Analytics 4
- Google Tag Manager Help: Consent mode
- Data Protection Commission: Guidance note on cookies and other tracking technologies
Want analytics you can act on?
We set up and manage Google Analytics 4, cookie consent and conversion tracking for businesses all over Ireland, and explain what the numbers mean.